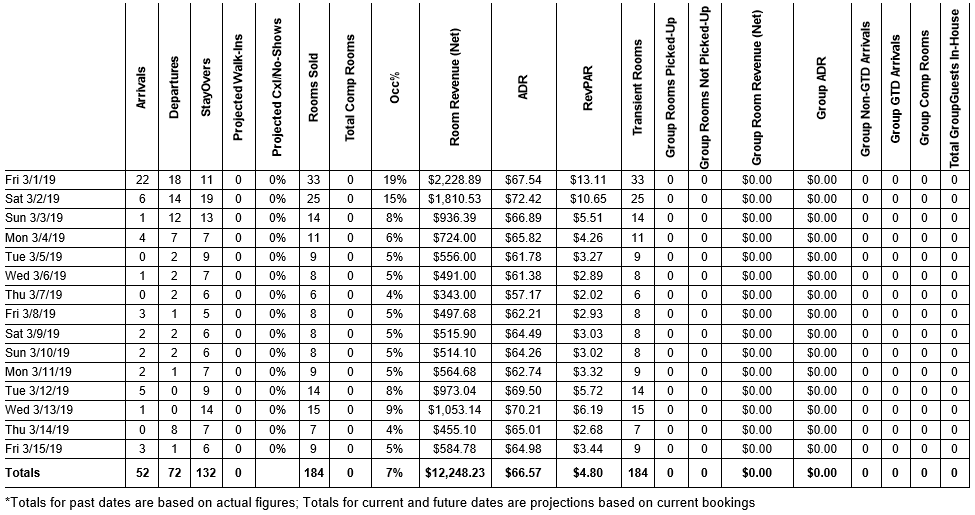
The below example was printed over a 15-day date range. Keep in mind that while the report does not specify a limit on selected date range, larger date ranges may impact performance in Chorum. For this reason, MSI recommends limiting the printed range to 30 days at a time.
Expand each of the below items as needed for more information about a given column:
 Date (unlabeled) This column displays the day of week followed by the calendar date referenced in the projection. If the Detailed Guest Breakdown filter option is checkmarked, this column will also include a row for Rms (Rooms), Ad (Adults), CO (Children Over Cutoff Age), and CU (Children Under Cutoff Age), with individual breakdowns to the right where applicable. Otherwise, the report will only display room values to the right.
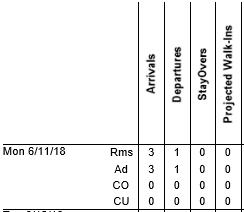
- Arrivals This column displays the count of guests whose arrival date matches the projected business date, including day-stays.
- Departures This column displays the count of guests whose departure date matches the projected business date, including day-stays.
- Stayovers This column displays the count of guests expected to be in-house and not due to depart until a later date as of the projected date. For example, in the above figure the hotel shows 11 stayovers for Friday, 3/1/2019. This means 11 guests who arrived before this date (2/28 or earlier) have a departure date set for 3/2/2019 or later.
- Projected Walk-Ins This column can be added or removed from the report by checking or unchecking the Use Walk-In Forecast filter in the Options ribbon at the top of the report before generating it. If you intend to use this feature, you must manually include your predicted projections (either using an external program that reports predictions based on historical data, or manually estimating counts yourself) using the Enter Walk-In Projections button beneath the checkbox.
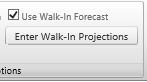
The menu for this option allows you to manually enter walk-in projections for specific days of the week over a set date range. In the above example, the hotel included the column in their report but has not entered any walk-in projections; the result is a 0 for every day listed in the report. - Projected Cx/No-Shows This column provides a percentage of all reservations with an arrival date matching the projected date that were cancelled prior to arrival. If you are printing this report for the past, it will also include the reservations that failed to arrive (no-shows) in the total percentage. Likewise, if you process a no-show in advance, this will also be included in your printed projections.
- Rooms Sold This column provides a count of all rooms booked and/or already occupied on the given business date. This value does not account for comp’d rooms.
- Total Comp Rooms This column provides a count of all rooms arriving on the associated business day or already in-house with a rate of $0.00 (i.e., a “complimentary’ room)
- Occ% This calculates the projected occupancy percentage of your hotel, by diving your rooms sold by your total available (on market) rooms. For example, if you have 5 rooms sold for the day out of 100 available rooms, you would have an occupancy of 5%. You may also notice that at the bottom of this column in the Totals row, the Occ% value does not display a total like the rest of the columns do. Instead, this column shows the average occupancy over the printed date range, rounded down. (In the above figure, adding the occupancy of each day together then dividing by 15 results in 5.86%, or, rounded down, 5%).
- Room Revenue (Net) For future dates, this is the projected room revenue collected from all in-house and arriving guests for the business day, based on the rate assigned in each folio. For past dates, this will be the revenue that was actually posted to each guest’s folio.
- ADR Your Average Daily Revenue for the business date. The value is calculated by dividing your net (projected) room revenue by your rooms sold for the day. If the answer would result in a fraction of a penny, the fraction is rounded to the nearest whole penny ($1.041 = $1.04, while $1.046 = $1.05). Ideally your ADR should be as close to your hotel’s Rack rate as possible.
- RevPAR Your Revenue per Available Room. This value is calculated by dividing your net (projected) room revenue by your total available (on market) rooms (not displayed on this report). Ideally your RevPAR should be as close to your ADR as possible.
- Transient Rooms This column provides a count of all bookings for the associated business date not associated with a group contract.
- Group Rooms Picked-Up This column provides a count of all group blocks that have been “picked up,” or in other words, converted into reservations. These count as rooms sold for the day.
- Group Rooms Not Picked-Up This column provides a count of all group blocks in inventory that have not yet been converted into reservations. These do not count as rooms sold, and thus will not factor into your daily revenue projections.
- Group Room Revenue (Net) This column functions exactly like the Room Revenue (Net) column, but only accounts for group reservations.
- Group ADR This column functions exactly like the ADR column, but only accounts for group reservations. The final calculation is Group Room Revenue (Net) for the day ÷ Group Rooms Picked Up.
- Group Non-GTD Arrivals All picked up reservations arriving on the associated business date with non-guaranteed holds (such as cash) set.
- Group GTD Arrivals All picked up reservations arriving on the associated business date with guaranteed holds (such as credit card or advance deposit) set.
- Group Comp Rooms All picked up reservations or in-house group guests with a rate of $0.00 (complimentary).
- Total Group Guests In-House The final total of all checked in group members on the associated business date.
Along the bottom of the report is a combined total of all values for the printed date range. The only column that behaves differently is the Occ% column - this is instead your hotel’s average occupancy over the entire printed date range.